Support Reporting
The support module includes a Support Dashboard to provide visibility of all requests. This dashboard also provides key insights such as the average time to close a request, and the total number of requests by department
Support Dashboard
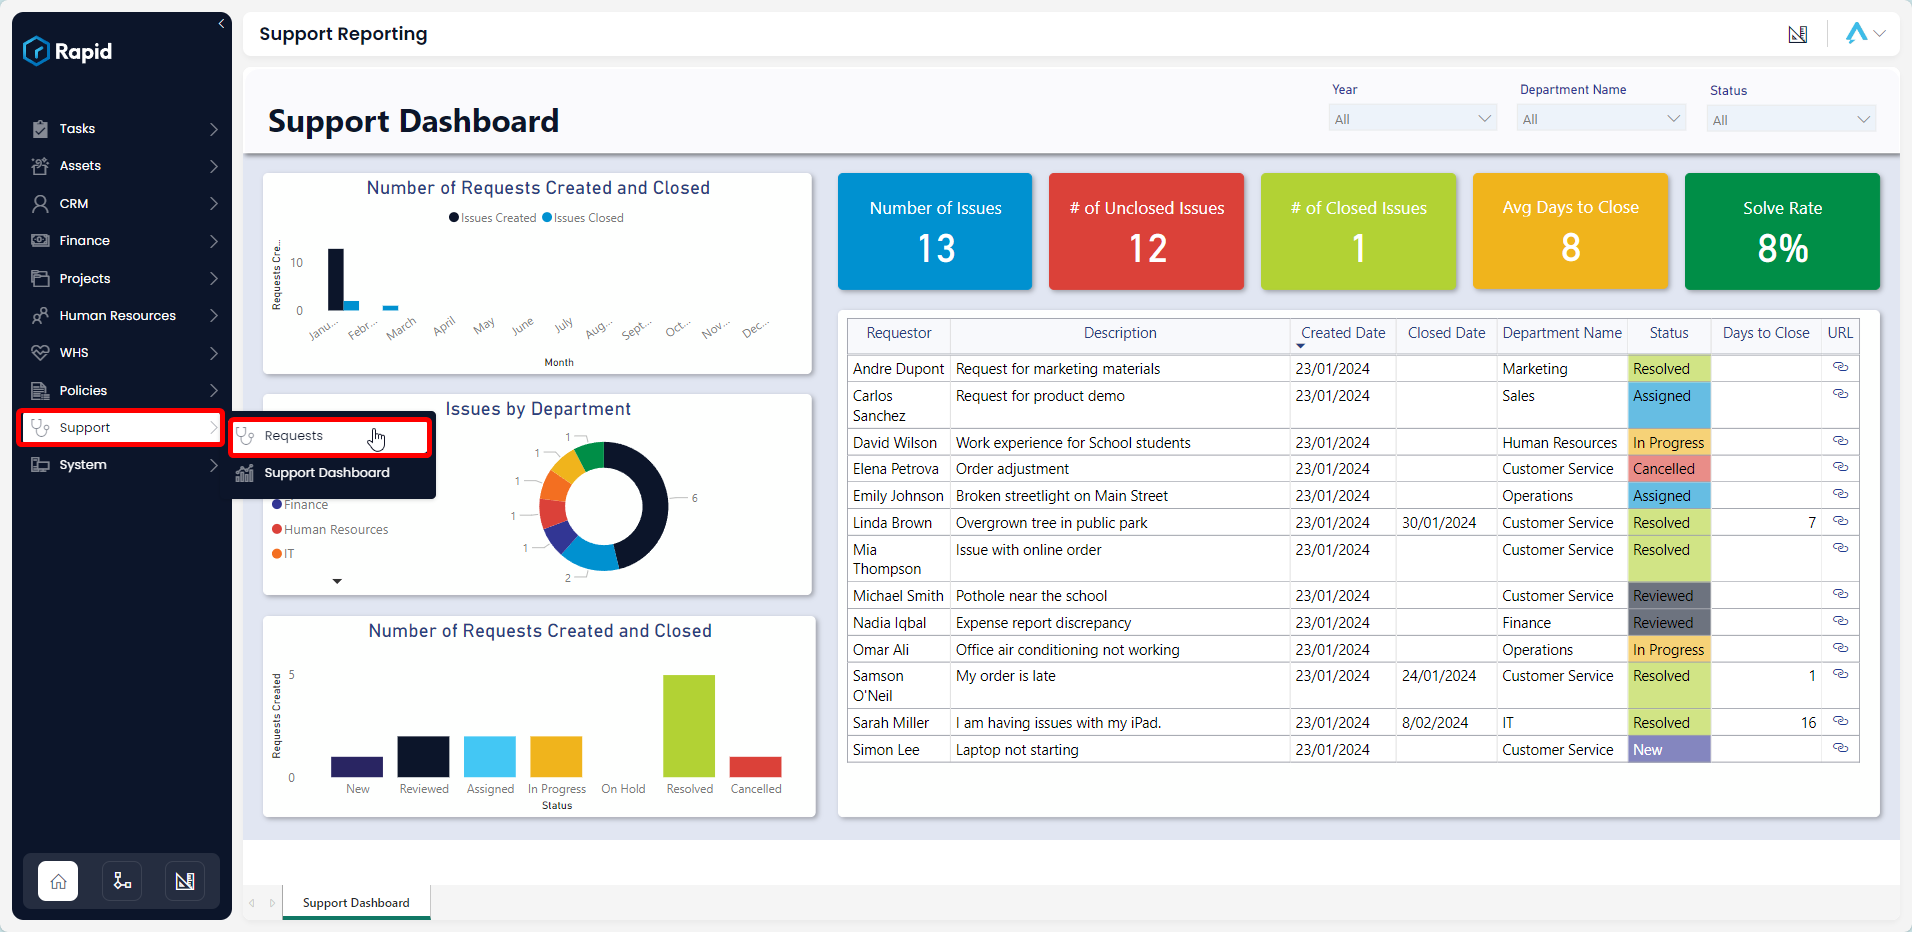
Accessing the Incidents Report
- On the Explorer sidebar click Support > Support Dashboard
The Incidents Report is divided into four sections: slicers, charts, cards, and the incidents table.
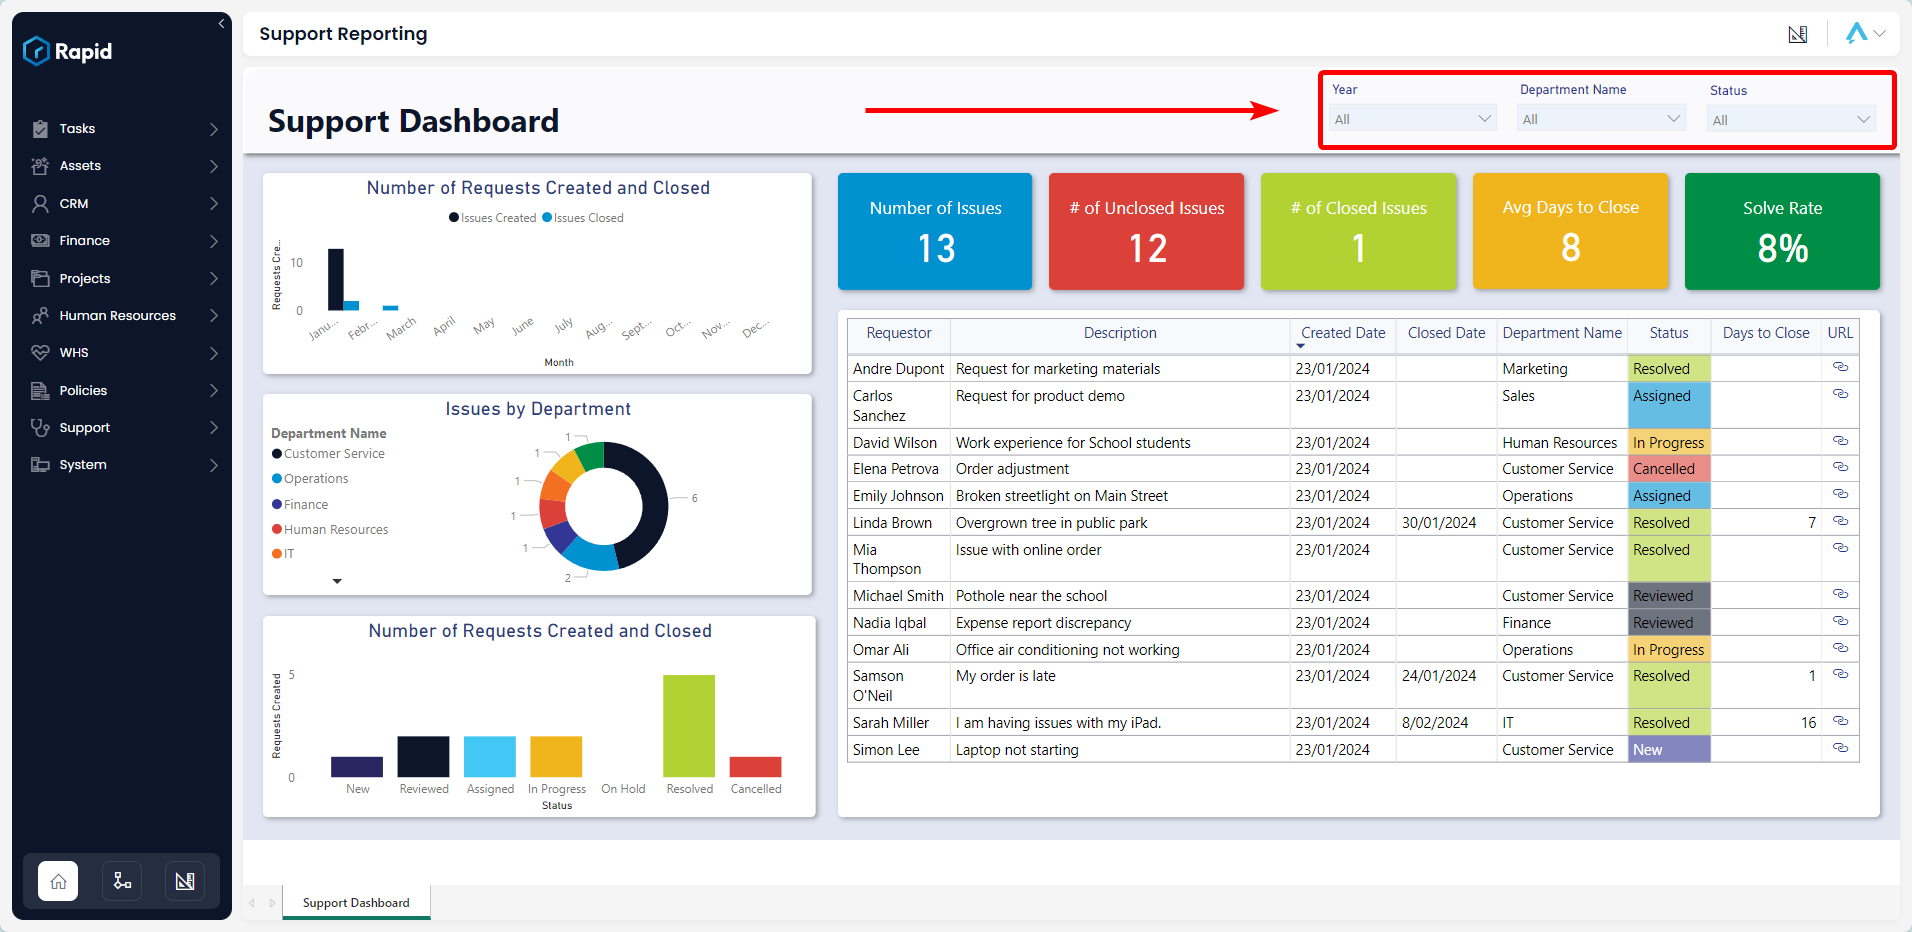
Slicers
Slicers can be found at the top of the page, and provide the user with the ability to filter all of the visuals on the page by a specific attribute.
The Incidents Report can be “sliced” based on no attributes, a single attribute, or multiple attributes. The slicers available on the support dashboard are: Year, Department Name, and Status.
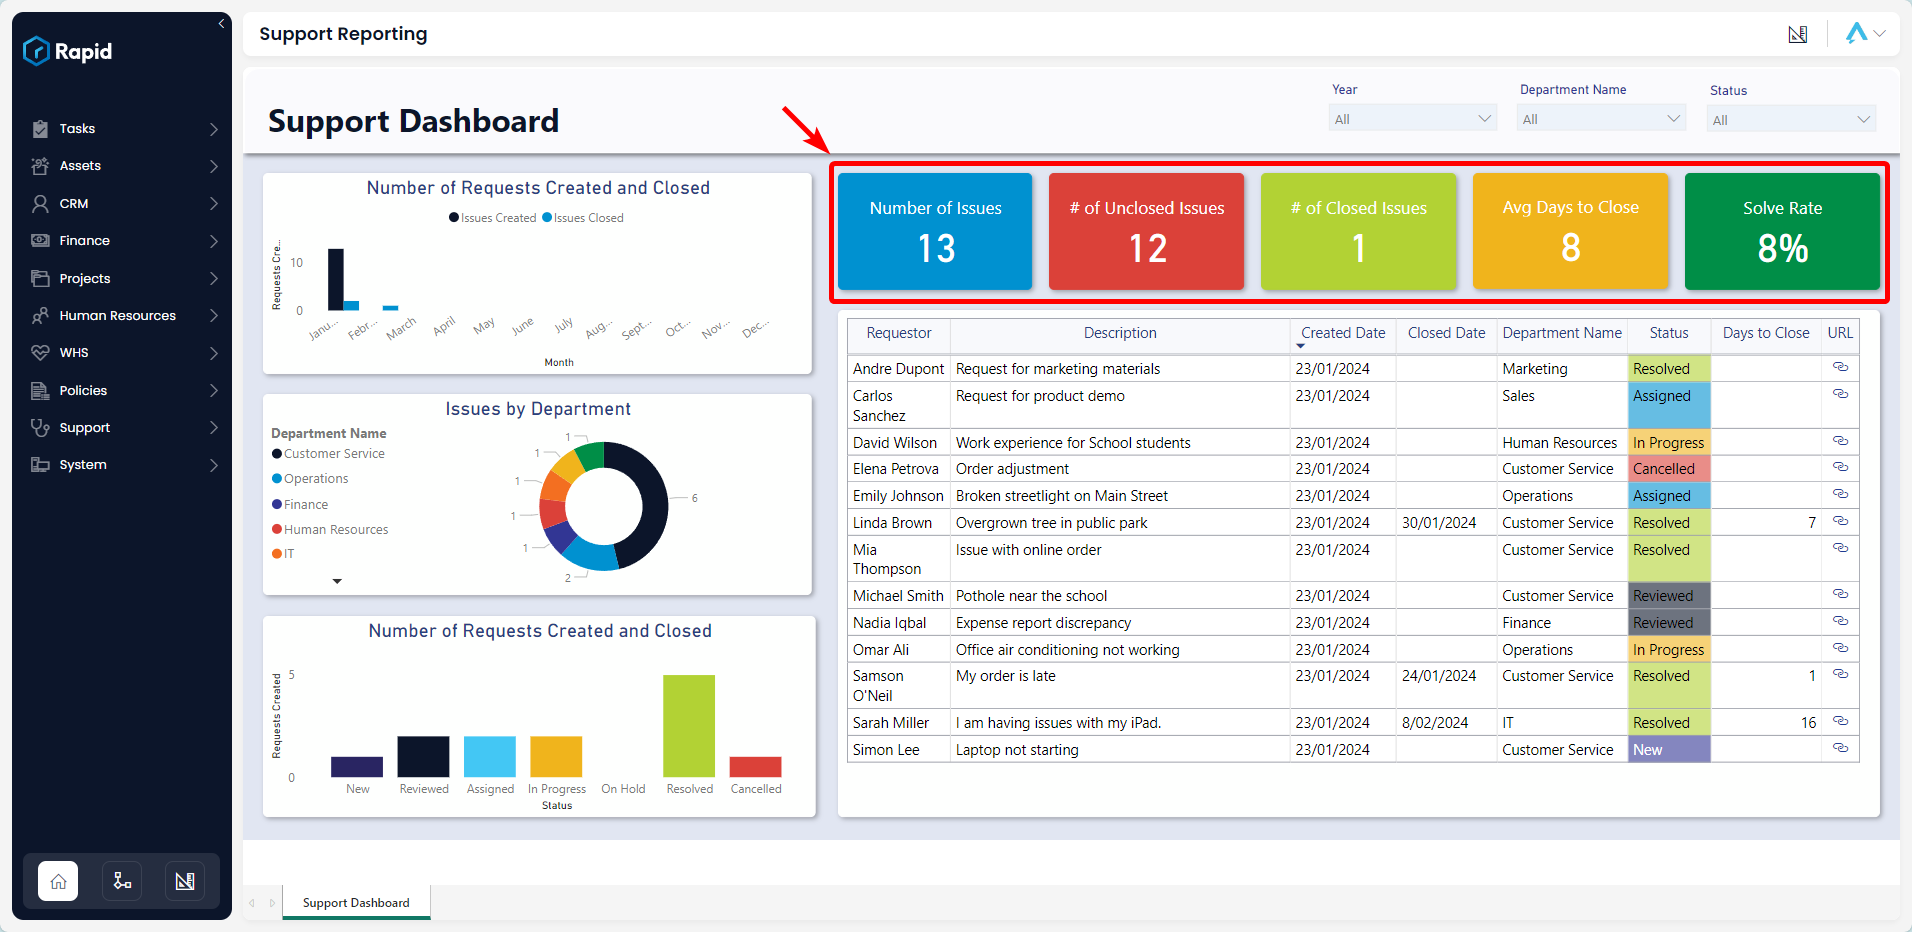
Cards
The Cards section within the Incidents Report offers concise statistics. The values of these cards will change based on the report's slicers, or if selections are made on the report's table and charts. The Incident Report cards are as follows:
- Number of Requests – Displays the total number of requests
- # of Unclosed Requests – Displays the number requests where the status is not “Resolved” or “Cancelled”
- # of Closed Requests – Displays the number of requests where the status is “Resolved” or “Cancelled”
- Avg Days to Close – The average number of days from a request's creation date, to close date.
- Solve rate - # of Closed Requests, divided by the total number of requests displayed as a percentage
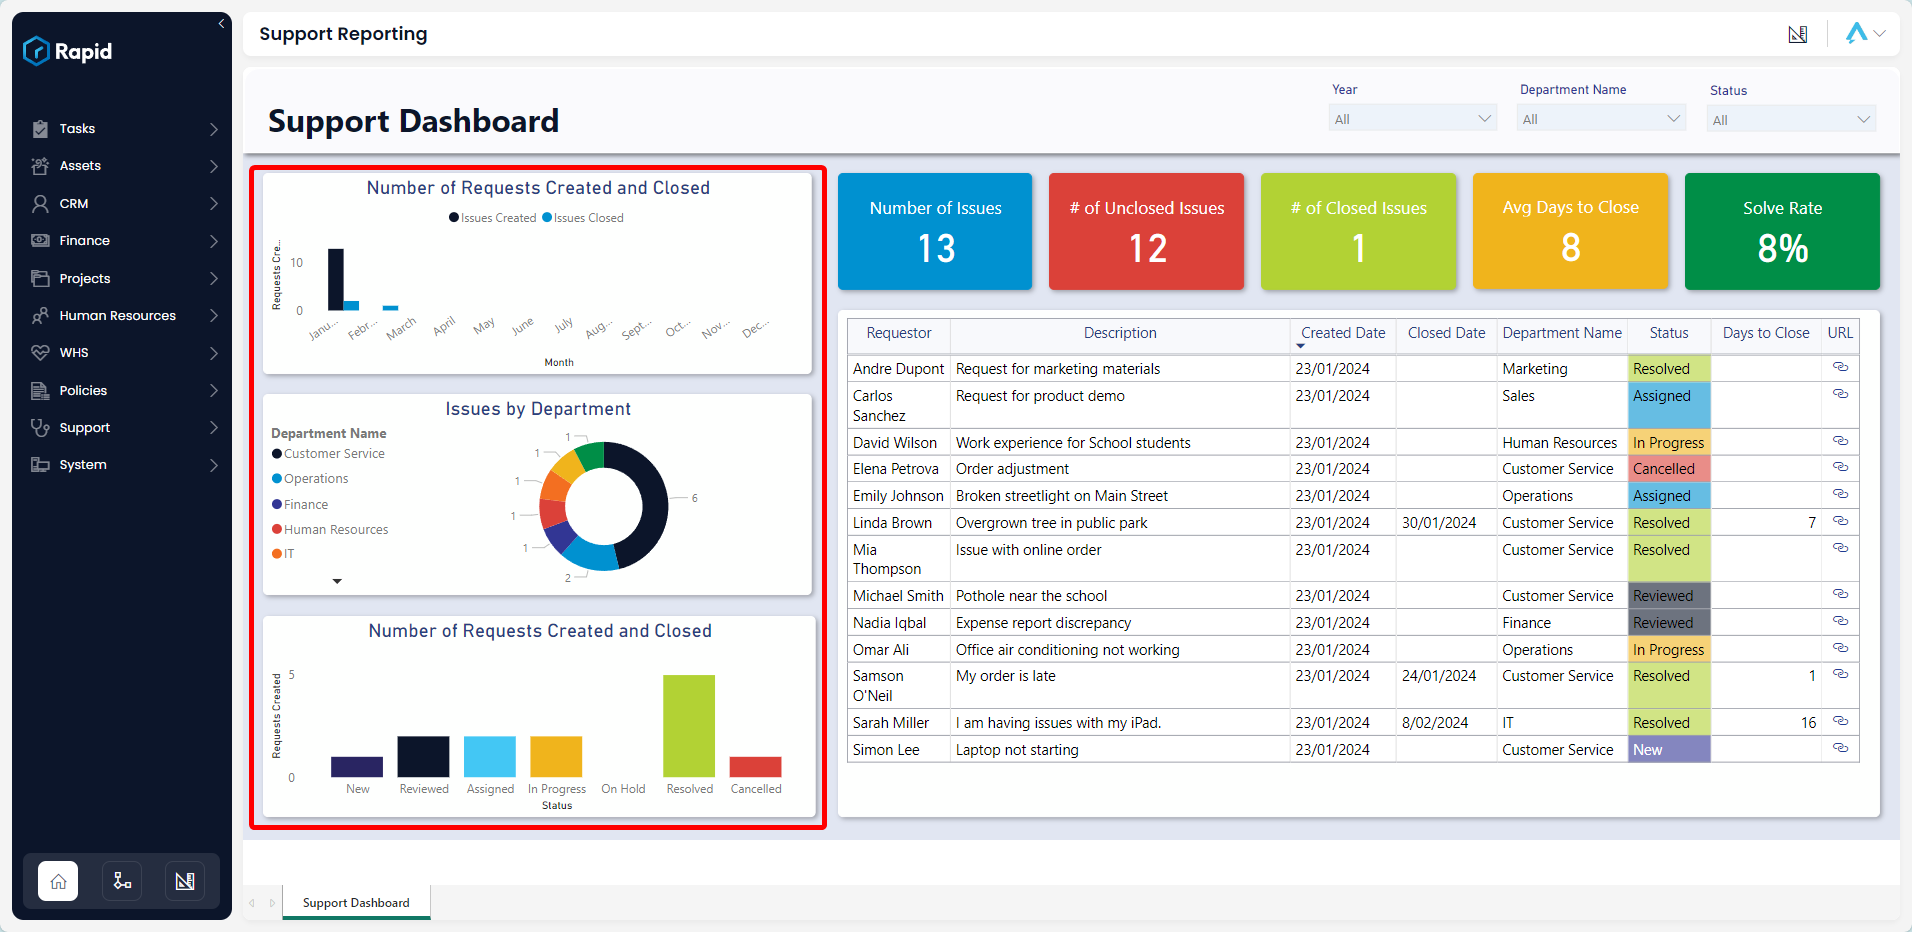
Number of Requests Created and Closed
The Number of Requests Created and Closed visual shows the number of requests created and closed through time.
It is an interactive visual, allowing users to slice the rest of the report by the selected month.
Requests by Department
This is a doughnut chart showing the number of requests by department.
It is an interactive visual, allowing users to slice the rest of the report by the selected department.
Number of Requests by Status
This Column Chart shows the number of requests by status.
It is an interactive visual, allowing users to slice the rest of the report by the selected status.
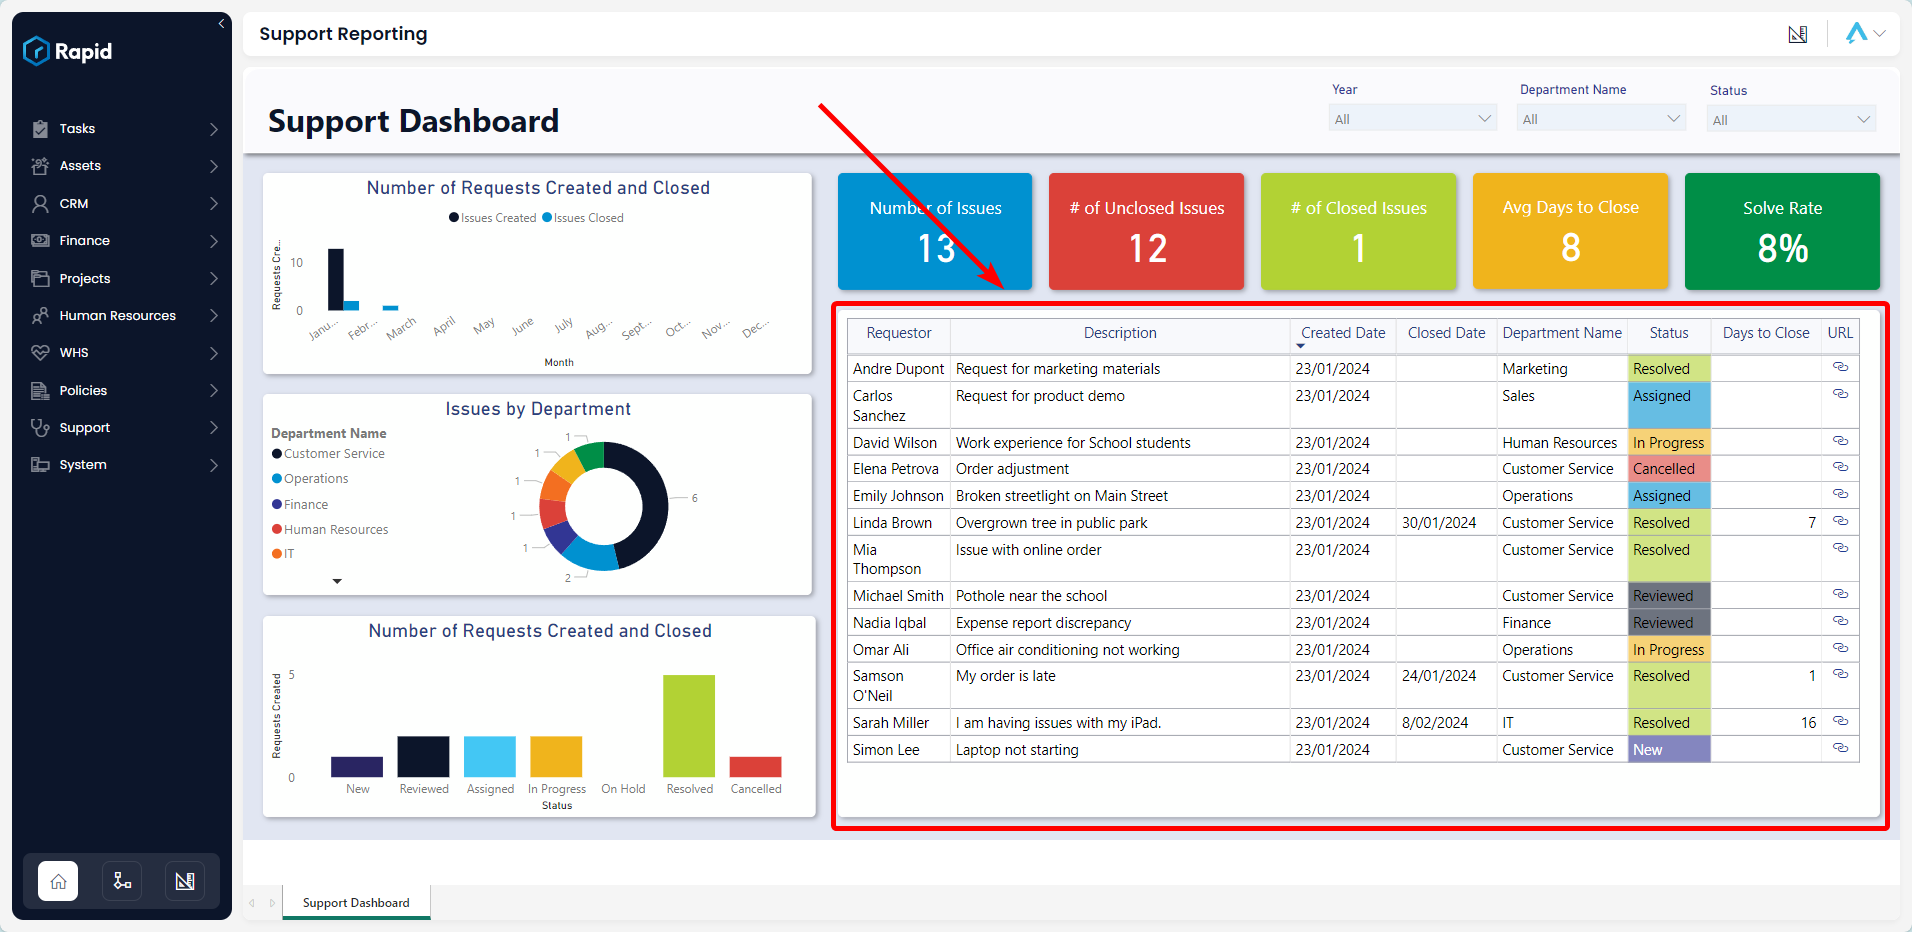
Requests Table
The Requests Table displays the Requestor's Name, a Description of request, Created Date, Closed Date, Department Name, Status, Days to Close, and a Link to the request item in Rapid.
It is an interactive visual, allowing users to click any request line. The report's visuals will highlight or filter based on the selected request.